Key takeaways
- The yen posted its biggest one-day gain against the dollar since 2022 on Thursday, recovering as much as 3% from a fresh 40-year low before handing back most of that ground.
- Japan has not confirmed intervention. Reports indicated yen buying during New York hours, with the communication approach deliberately changed so that short-yen positions couldn’t be unwound in advance.
- The Bank of Japan held its policy rate at 1.00% by an 8-1 vote, with one board member dissenting in favour of a hike to 1.25%.
- USD/JPY is now testing the 160.5 zone as resistance, with 158 back in view on a rejection and 162.5 the next area of interest on a reclaim.
The macro picture
The yen posted its biggest one-day gain against the dollar since 2022 on Thursday, recovering as much as 3% from a fresh 40-year low before handing back most of that ground within a single session. Nothing has been officially confirmed. Reports indicated that Japan bought yen and sold dollars during New York hours, and a market source described the operation as deliberate, with the communication approach changed from the previous round so that speculators couldn’t unwind short-yen positions in advance. Washington is reported to have run a rate check on the pair, which suggests little objection from the US side. The Bank of Japan then held its policy rate at 1.00% on Friday by an 8-1 vote, with one board member dissenting in favour of a hike to 1.25% and the statement stressing a readiness to keep tightening.
The move faded because the forces pushing the yen lower are still in place. The US policy rate sits at 3.50% to 3.75% after Wednesday’s divided hold, against 1.00% in Japan, and a gap that wide continues to make short-yen positions profitable to carry. June’s US inflation data, released Thursday, looked helpful on the surface, with headline PCE cooling to 3.7% from 4.1% and the core rate easing to 3.3%. Almost all of that relief came from energy, where prices fell 5.9% on the month during a brief lull in the Middle East fighting. That lull has since broken down and crude has climbed again, so the disinflation the print captured could already be unwinding. Second-quarter growth slowed to 1.5% annualised from 2.1%, though the shortfall came largely from government spending and inventories rather than from demand.
Japan’s side of the equation is where the difficulty sits. The country imports more than 87% of its energy, and the value of its petroleum imports rose more than 59% year on year in June, so a softer currency and dearer crude compound one another directly. Domestic inflation still doesn’t argue for urgency, with core consumer prices up 1.6% in June, below the 2% target for a fifth consecutive month. The Bank’s statement warned that underlying inflation is likely to exceed that target, which is a forward-looking judgement about imported costs rather than a description of what households are paying today. Governor Ueda’s press conference follows the decision, and the Ministry of Finance’s monthly intervention data is also due.
USD/JPY daily chart
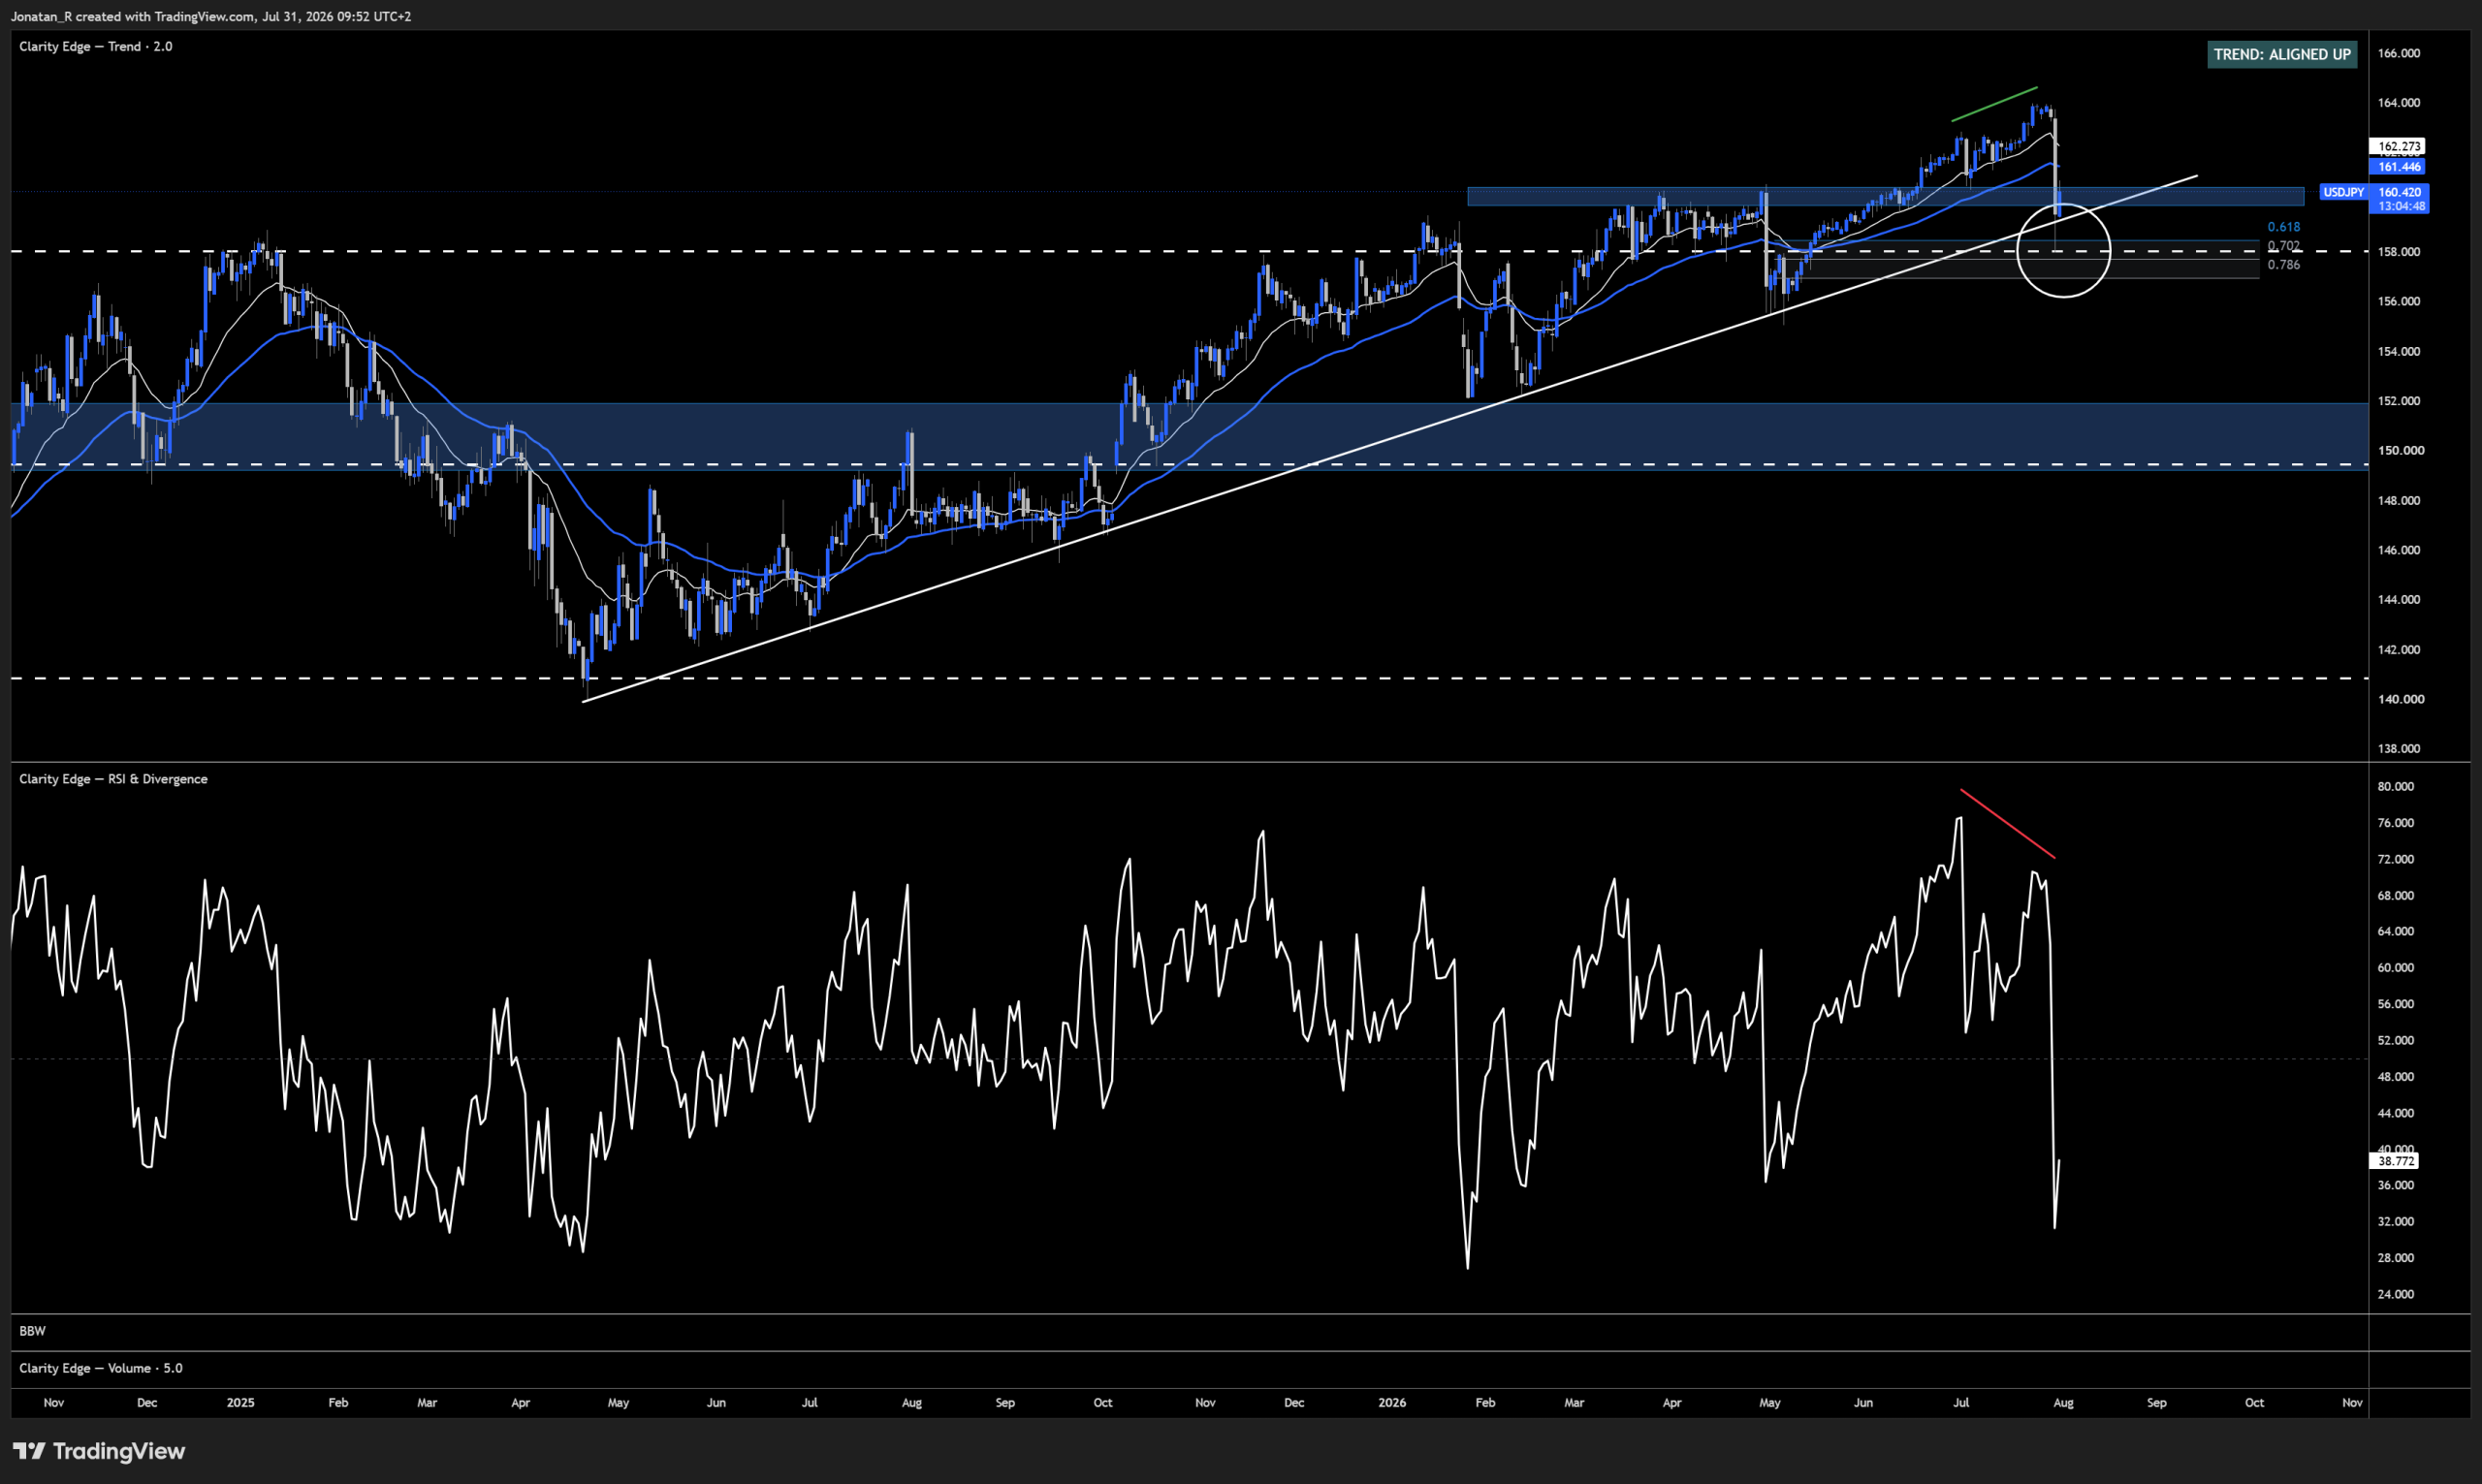 The daily chart shows the wick from yesterday’s move reaching the highlighted support area before price recovered back toward the 160.5 zone.[/caption]
In our previous coverage of USD/JPY we marked out the area sitting below the market as potential support. Yesterday we had a massive candle on potential rumours of Bank of Japan intervention, and the wick came down and hit the area within the white circle almost perfectly.
Looking at the daily RSI, we did have a bearish divergence leading up to the move yesterday, marked with a red descending trend line on the RSI indicator and a green ascending trend line on the price chart. The move yesterday also came down and hit the area of the long reload zone and the area around the overall range highs.
While momentum is starting to show signs of fading here, the trend is still very much alive. We are now testing that 160.5 zone as resistance. A reclaim of this level could potentially see more upside on USD/JPY, while a rejection could potentially bring price back down to start testing the 158 levels again.
USD/JPY 4-hour chart
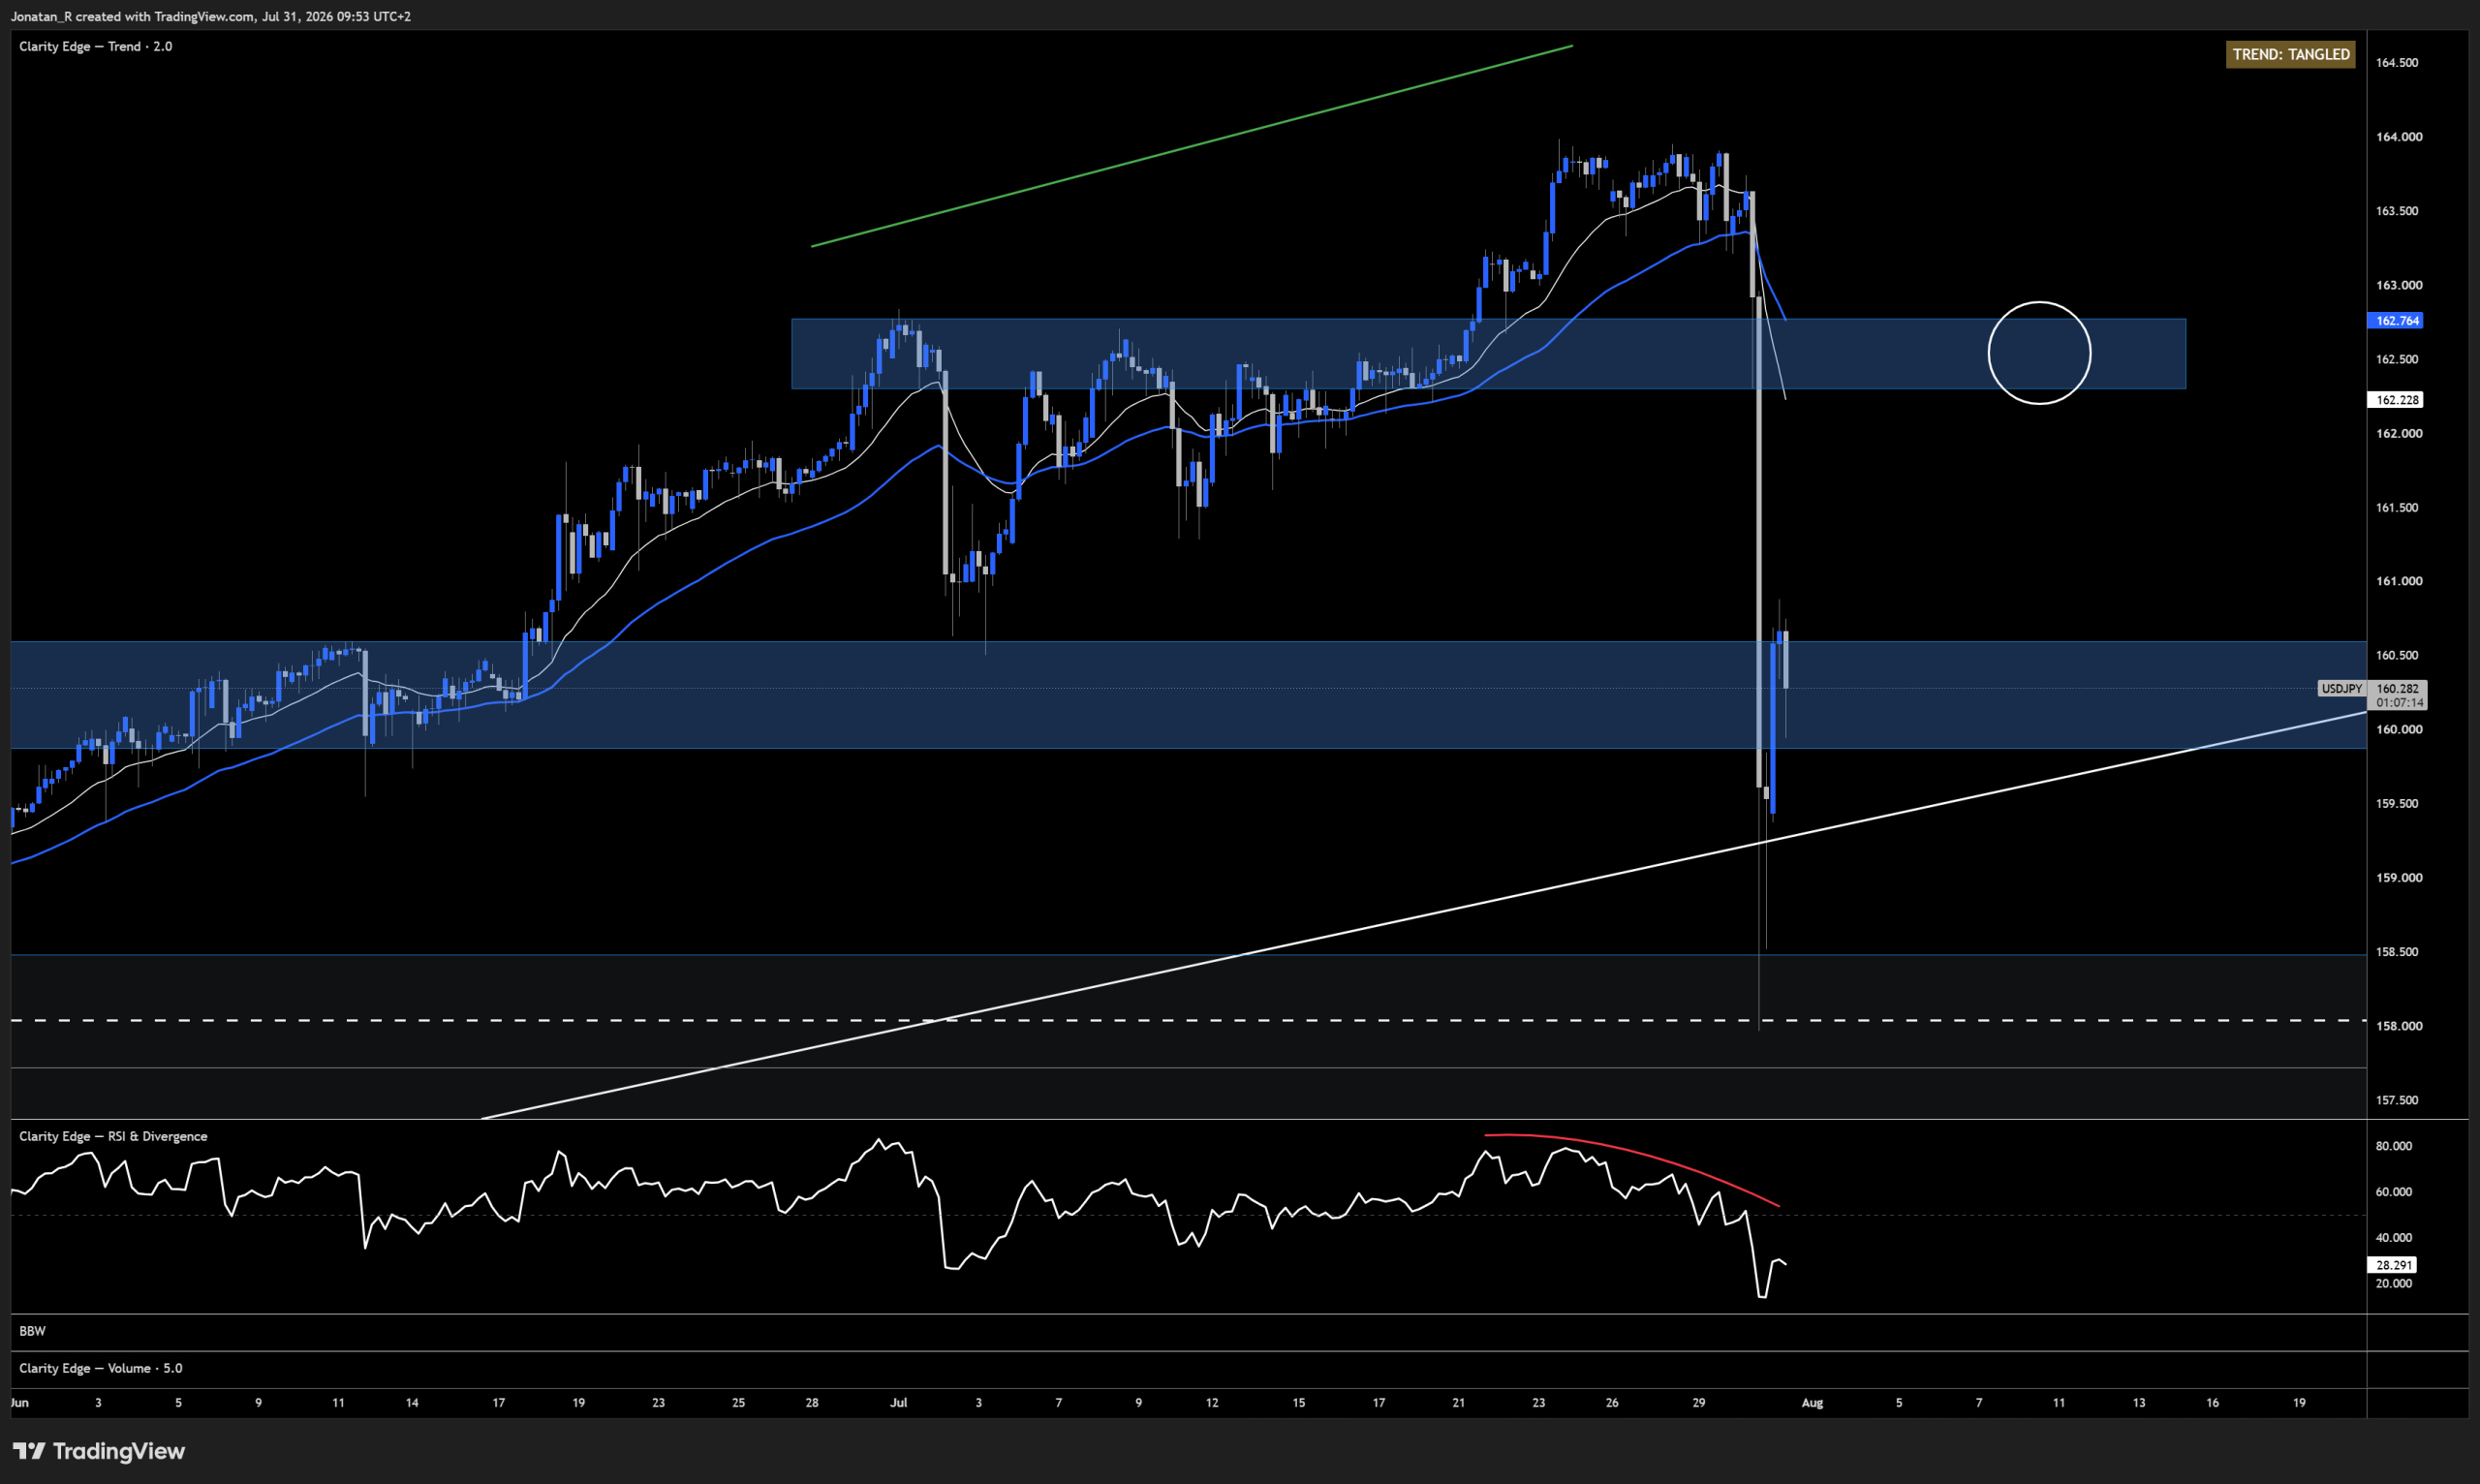 The four-hour chart shows price holding above 160 after the drop, with the 162.5 area marked above.[/caption]
Zooming into the four-hour chart and looking at the local price structure, what we can see is a very strong move on price and yet another sign of a bearish divergence. Between price and the RSI at the bottom here, we have that downward-sloping trend line while price was consolidating at the highest part of the move before the drop.
The question now is whether we use this current level as resistance for that move down to 158, or whether we could potentially see a reclaim of the 160 level as support. If we do see a bounce from current areas, the next logical resistance could potentially be the area at around 162.5, marked with the wide circle.
Trade Now
Trading involves risk.