Key takeaways
- The Nikkei has broken below the support region around 65,000 that it was defending last week and is now testing and bouncing on the 62,000 area, which lines up with the 50% retracement
- The daily 20 and 50 EMA are close to crossing for the first time since the end of March, although on the higher timeframes the primary trend still appears to be intact
- A rejection here could open a move toward the 60,000 to 58,000 zone, while a reclaim of the level around 62,700 could potentially take price back toward 66,400 to 67,200
- Three Japanese chip earnings reports, the Federal Reserve decision and the Bank of Japan meeting all land between today and Friday
The chip selloff has reached Tokyo
The Nikkei fell roughly 4% on Tuesday to a two-month low, and after making a fresh low on Wednesday it has recovered part of that move as this is written. The selling has been concentrated rather than broad. The index is price-weighted, so heavy falls in a handful of expensive chip names have done most of the damage, and the wider Topix has declined materially less. Japan has not been the worst hit in the region either. South Korea’s benchmark triggered circuit breakers on two consecutive sessions, reportedly for the first time, and now sits around 40% below its June high.
Three separate concerns have converged on the same trade. Chinese competition moved from theory to evidence when memory producer CXMT closed its Shanghai debut this week more than 460% above its offer price, days after reports that a state-backed firm has begun producing the lithography equipment export controls were designed to keep out of Chinese hands. Doubts about how the AI build-out is being financed have deepened alongside it, with suppliers increasingly seen as carrying part of their customers’ spending risk. Record quarterly profit at the region’s largest high-bandwidth memory producer also landed below what analysts had pencilled in, which moved attention from current earnings to the demand outlook behind them.
The calendar from here is dense. Advantest reports first-quarter results this afternoon in Tokyo, Tokyo Electron follows on Thursday and Kioxia on Friday, so the three Japanese names at the centre of the selling all report within 72 hours. The Federal Reserve announces at 2pm ET today, where a hold remains the base case although a hike has not been fully priced out, and the Bank of Japan concludes its own two-day meeting on Friday alongside a quarterly outlook report. The yen is trading near its weakest against the dollar in 39 years, which has historically supported Japanese exporters but now sits close to levels that have prompted both intervention talk and speculation about a faster pace of tightening.
Nikkei daily chart
In our previous coverage of the Nikkei last week, the index was bouncing at major support with chip stocks leading a rebound. That support has since given way.
Price is currently testing and bouncing on this 62,000 region, complementing the 50% fib. We can see that we have recently broken below a key support region around 65,000, and we have the daily 20 and 50 EMA about to give us a back cross for the first time since the end of March this year, when the latest move to the upside began.
Even though the index has taken a beating here and has broken local structure, looking at the high timeframes it does look like the overall primary trend is still alive. If we can get some consolidation around this 50% fib level, we could potentially create a consolidation phase forward and move to the upside from here.
If current levels fail, the area marked with the white circle between 60,000 and 58,000, where we have the 0.618 fib, aligns with a historically strong support region as well. We might find some support there if current levels would fail.
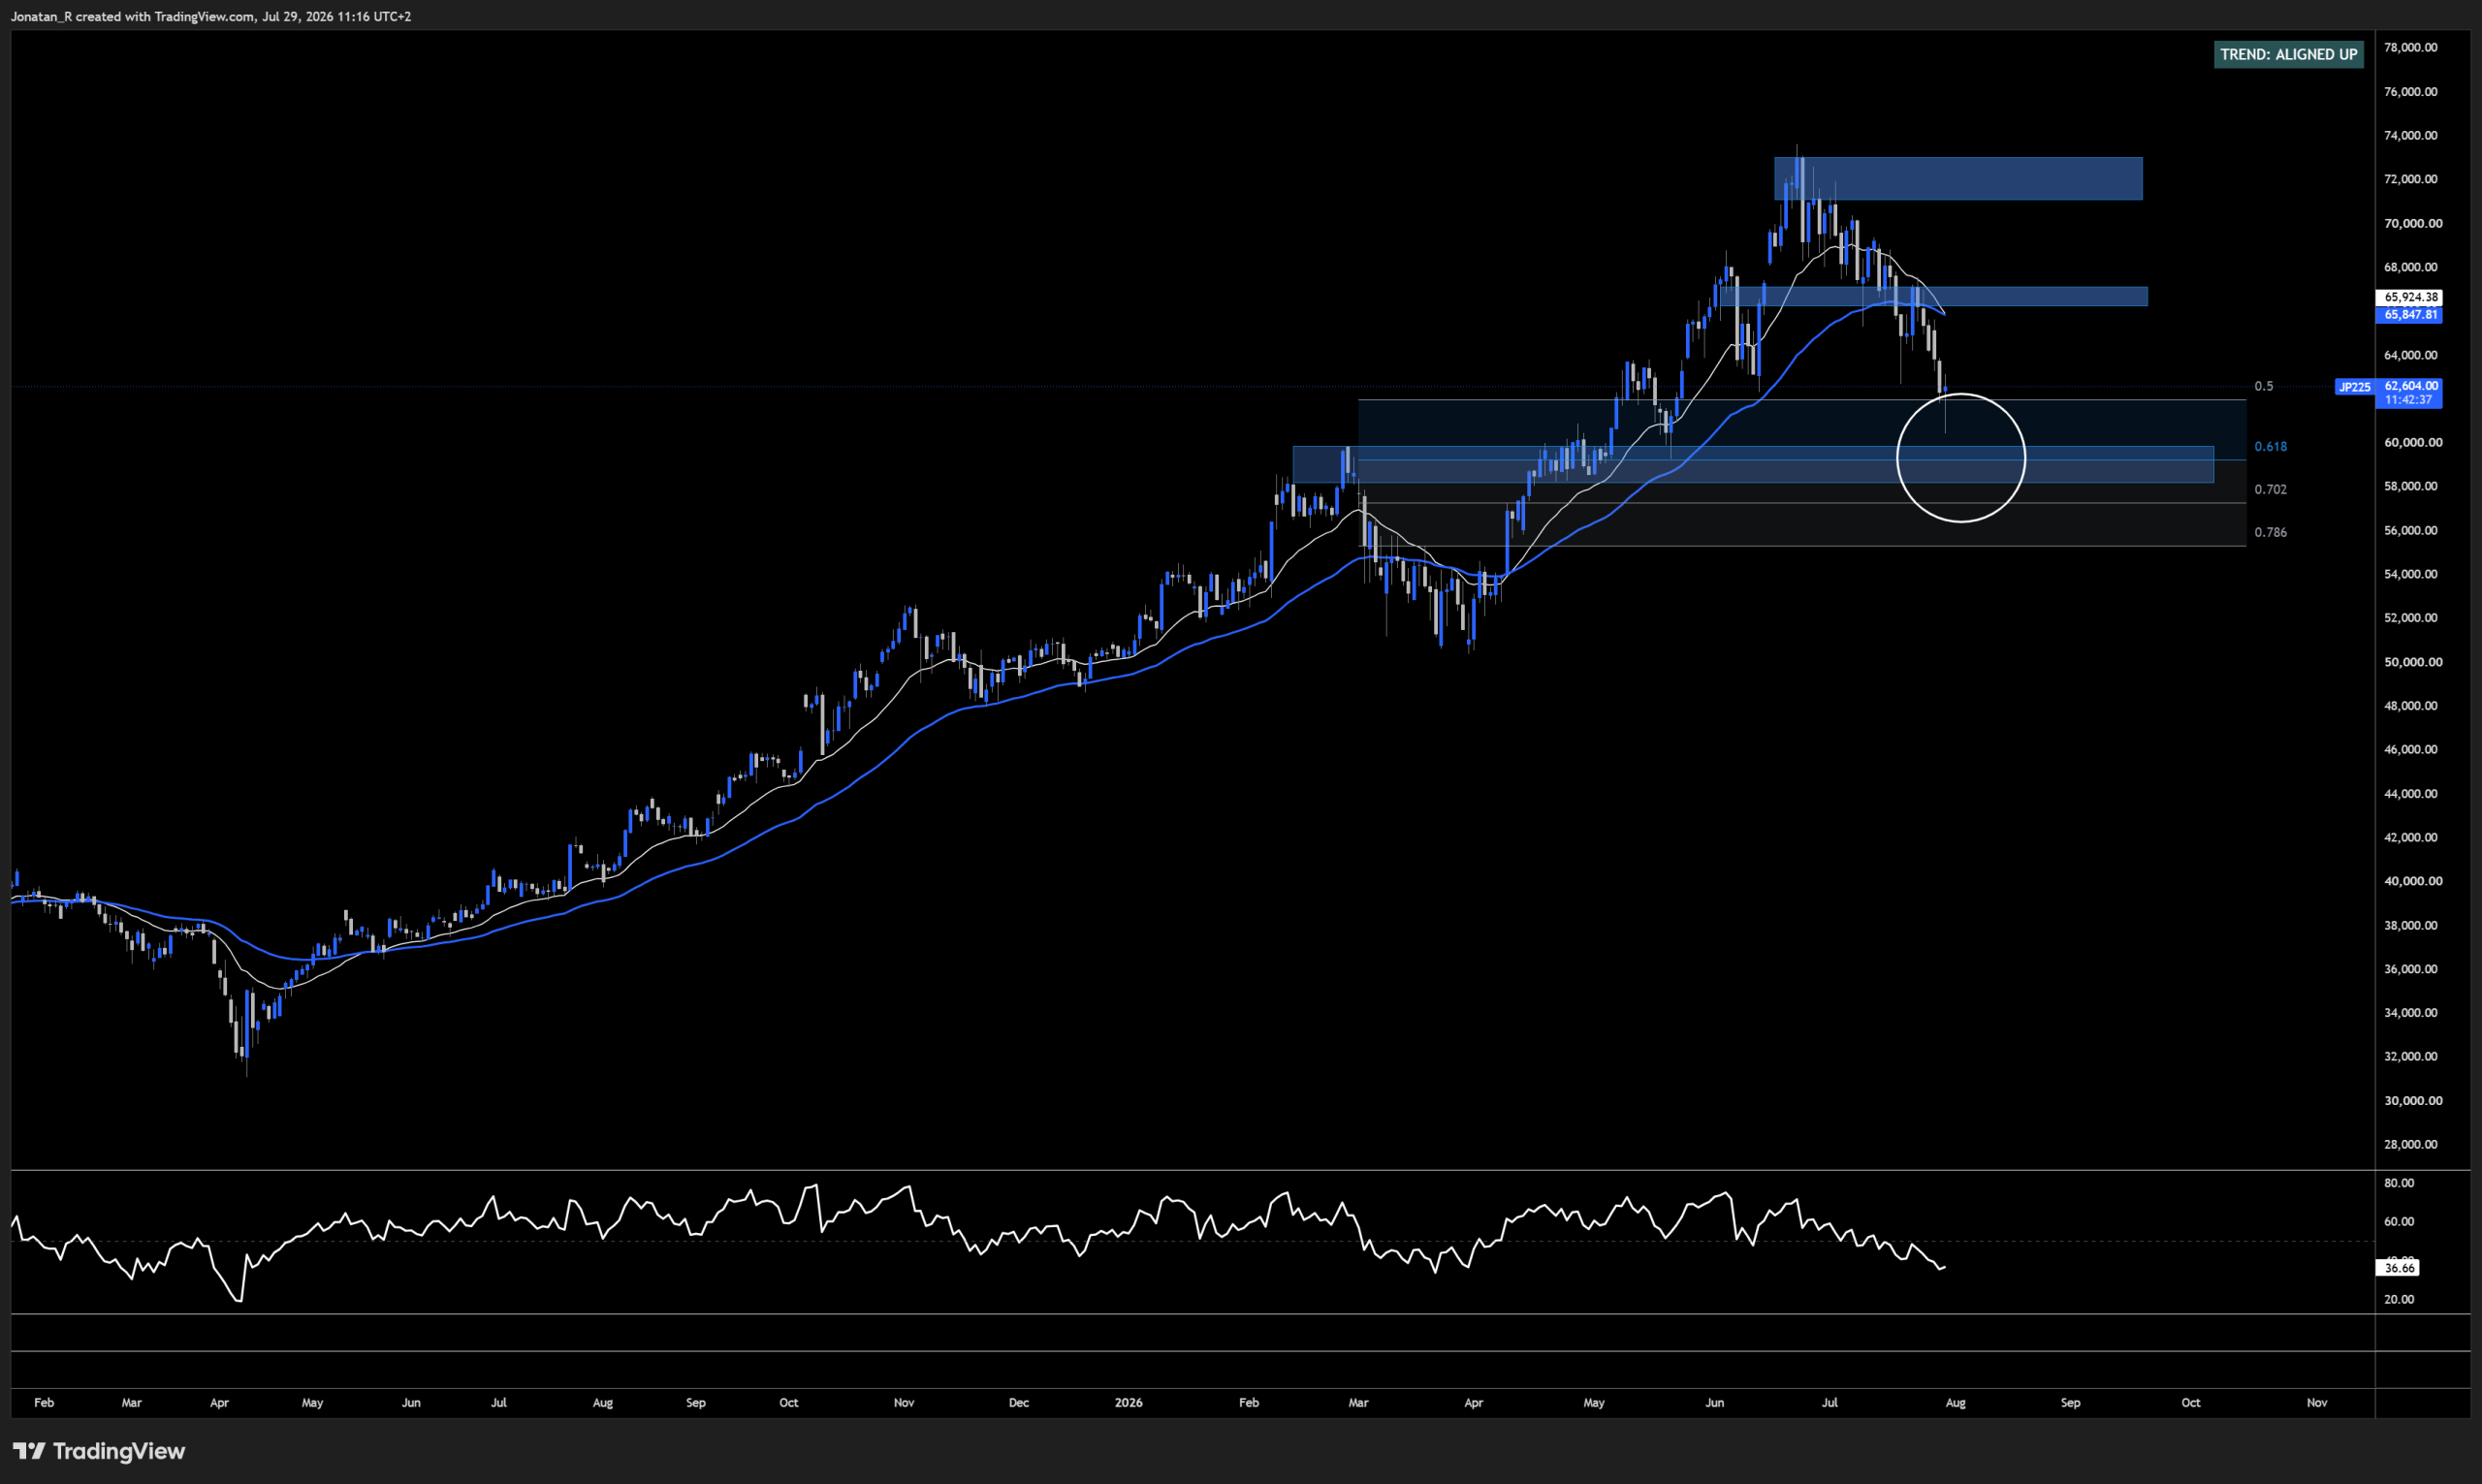 Caption: Price testing the 50% retracement below the broken support region, with the daily 20 and 50 EMA converging above.[/caption]
Nikkei 4H chart
Looking at the 4H here, we do see that we have a local downtrend with a fairly strong forward candle at the time of writing. If this 4H candle closes like this and we get a push above the horizontal levels at around 62,700, we could potentially see a local rebound here.
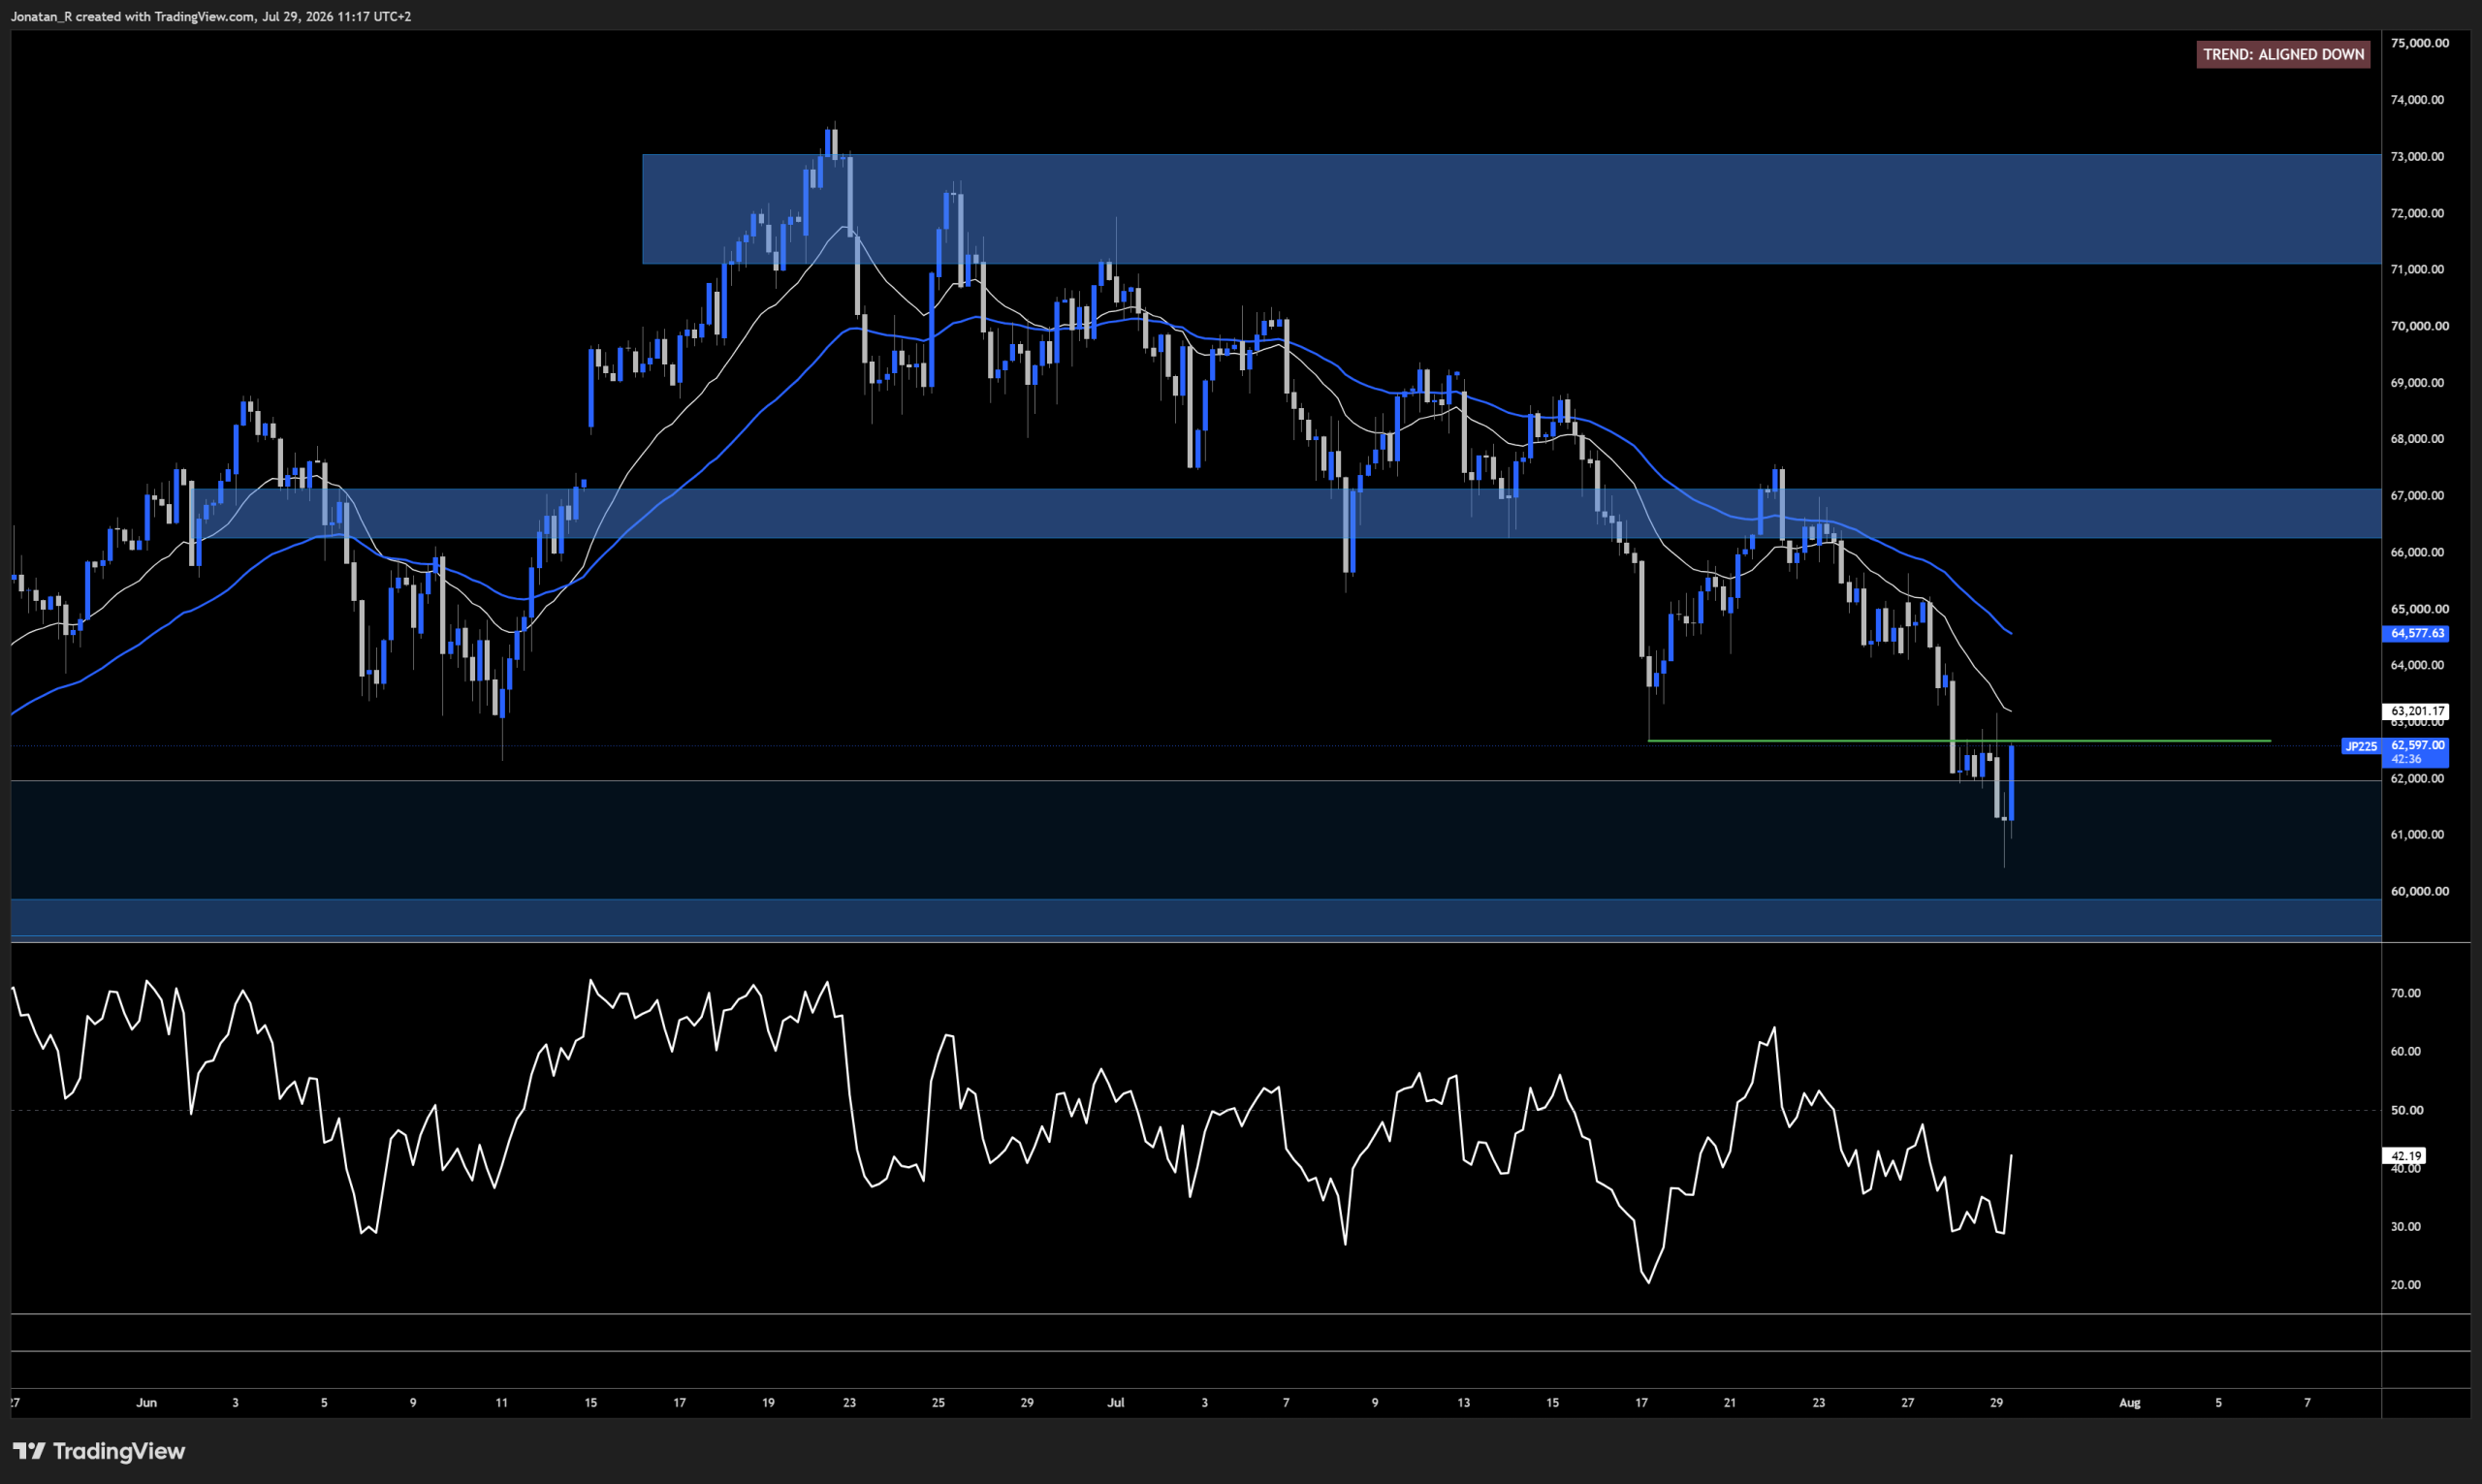 Caption: A local downtrend with price pushing back toward the horizontal resistance around 62,700.[/caption]
Nikkei 1H chart
Moving to the 1H, we see this level clear. We also have a bullish divergence coming in between price and RSI, as marked out with the green and red lines on the chart.
A rejection at this level could potentially take us down to the 0.618 high timeframe level, while a reclaim of this level could potentially take us back up to the area between 66,400 and 67,200.
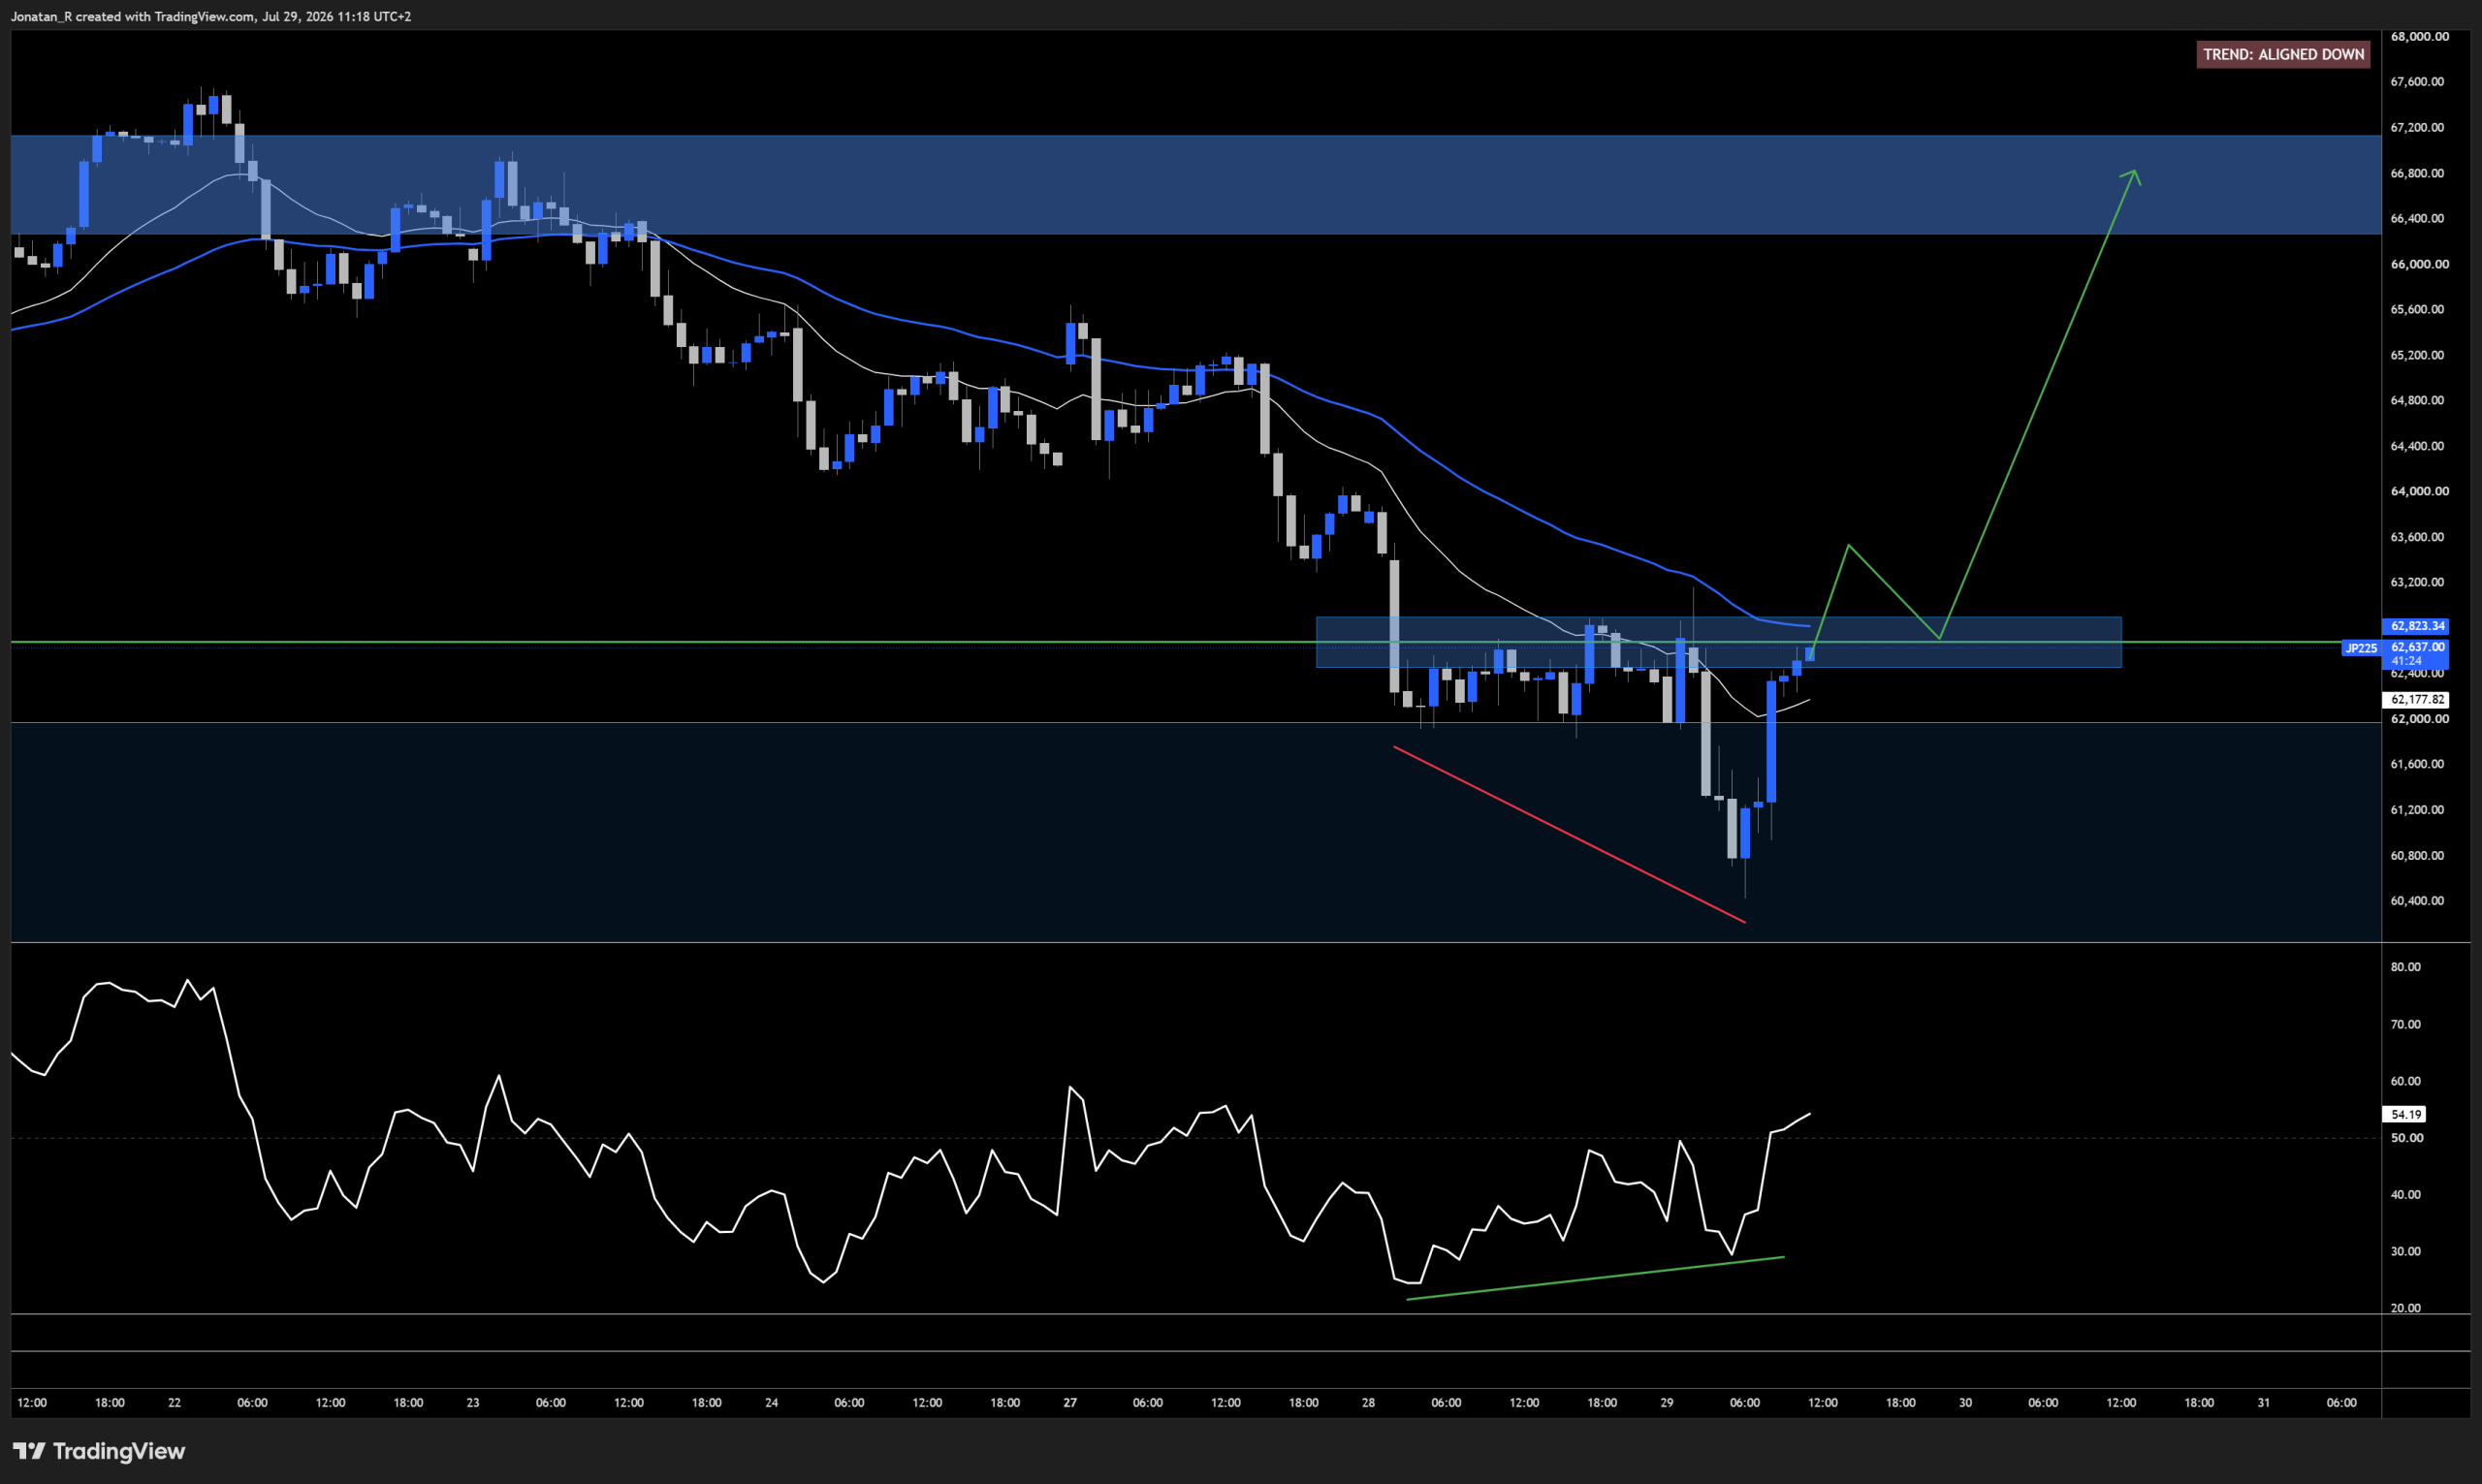 Caption: A bullish divergence between price and RSI as price tests the level around 62,700.[/caption]
Key levels to watch
- 62,000: the region price is currently testing and bouncing on, lining up with the 50% retracement
- 62,700: the horizontal level on the 4H and 1H, a reclaim of which could open a local rebound
- 65,000: the key support region recently broken, now above price
- 66,400 to 67,200: the upside area in view on a reclaim
- 60,000 to 58,000: the white circle zone containing the 0.618 retracement and a historical support region
- Daily 20 and 50 EMA: close to crossing for the first time since the end of March
Trading involves risk.