Technical picture
Bitcoin closed at $64,720.9, up $407.3 or 0.6% on the day, after opening at $64,313.6 and trading between $64,232.0 and $64,884.5. Price is consolidating directly on the 50-day EMA, the green line running near $64,915, while a slower average continues to slide down from the $70,447.3 area.
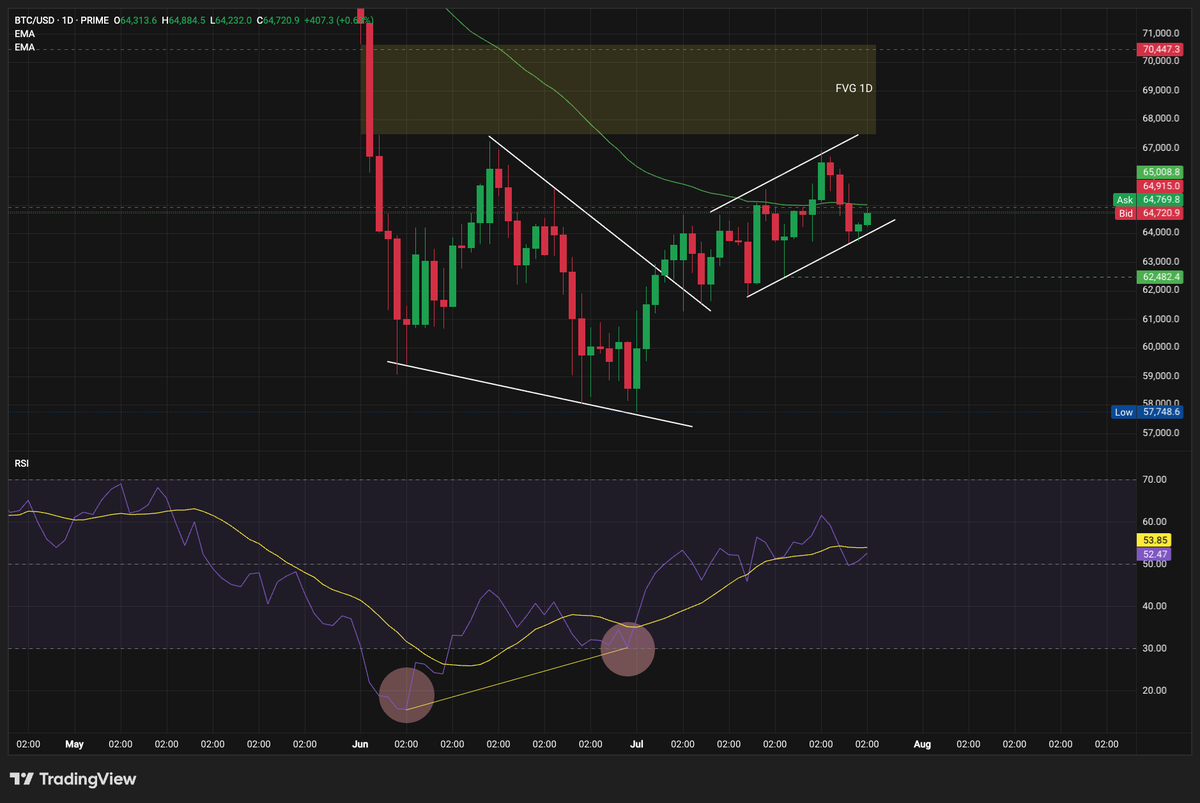
An unfilled daily fair value gap sits above, spanning roughly $68,000 to $70,447.3, and each session holding this shelf raises the odds of price reaching into it. The longer-term picture stays bearish, but the short-term impulse can extend. The green dashed line at $62,482.4 decides it, the base of the structure built off the $57,748.6 low. If it gives way, it opens the path back toward that low.
RSI reads 52.47 against a 53.85 signal average, both just above neutral. Two zones are marked: a bounce from near 17 in early June and a shallower dip near 32 at the start of July. Price set a lower low between them while RSI set a higher low, a bullish divergence the sections below echo.
Crypto heatmap
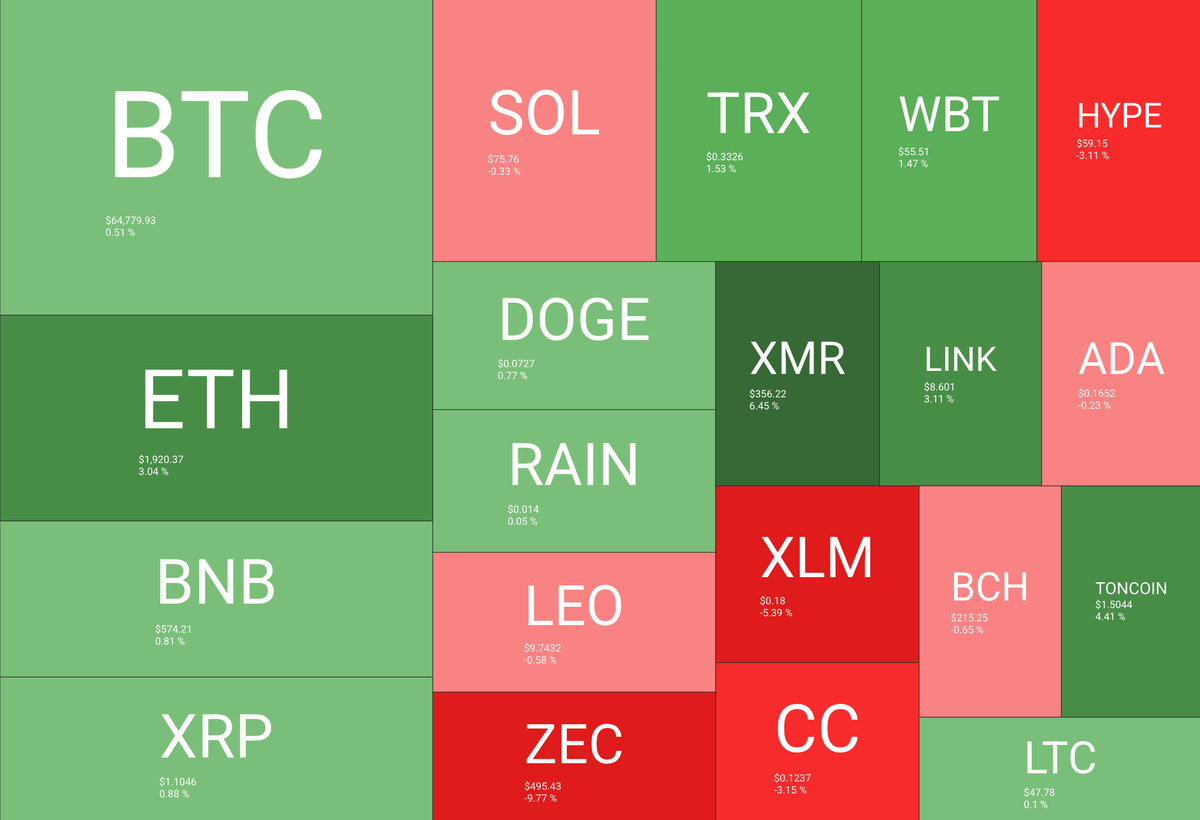
Bitcoin held near flat at $64,779.93, up 0.51%, while capital worked down the board. Ethereum added 3.04% to $1,920.37, the strongest of the large caps, extending a run of roughly 11% in the week into July 16 and about 20% month to date. Bitcoin travelled from $64,700 on July 19 to $66,910 on July 21 before sellers returned it to the low $64,000s by July 25.
Source: https://quantifycrypto.com/heatmaps
Monero led the board at 6.45% to $356.22, helped by a reported $23 million on-chain purchase, with Toncoin up 4.41% and Chainlink 3.11%. The losers were last month’s winners: Zcash gave back 9.77% to $495.43 as its rally cooled after the Electric Coin Company team resigned, Stellar fell 5.39% and Hyperliquid 3.11%. Money is not leaving, it is rotating, which is what the index below measures.
Altcoin Season Index
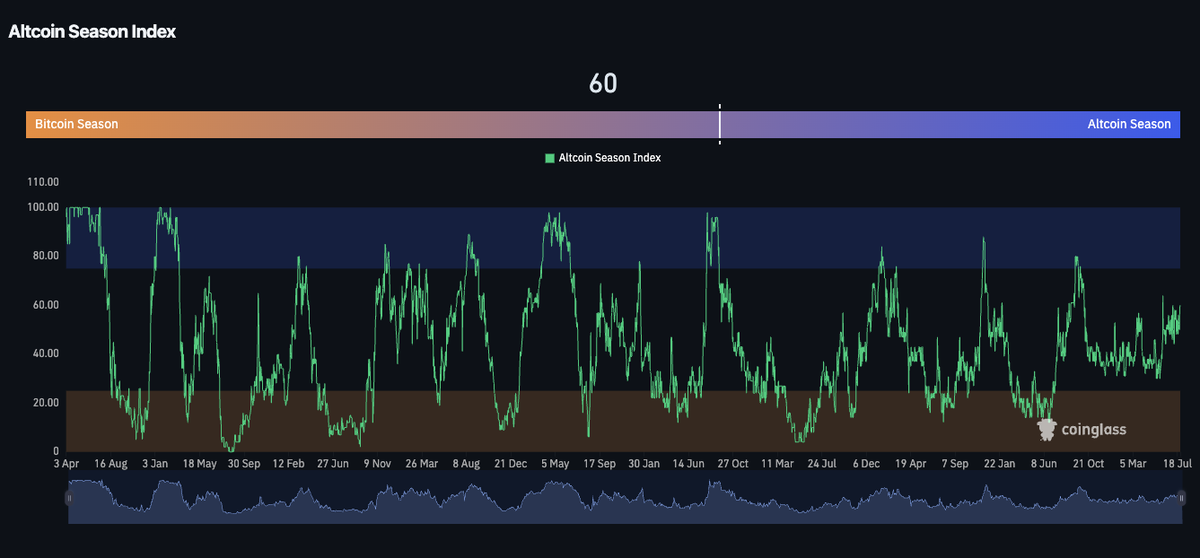
Coinglass’s Altcoin Season Index reads 60, up from 50 a week earlier and from roughly 10 in early June. Liquidity is moving out of Bitcoin into everything else, Ethereum first among them.
Source: https://www.coinglass.com/pro/i/alt-coin-season
The 75 mark is the threshold for a confirmed altcoin season, and it has also worked as a proxy for a medium-term top in prior cycles. At 60 the market sits between the two, leaving room for the stronger names without the crowding that comes with the extreme.
Fear and Greed Index
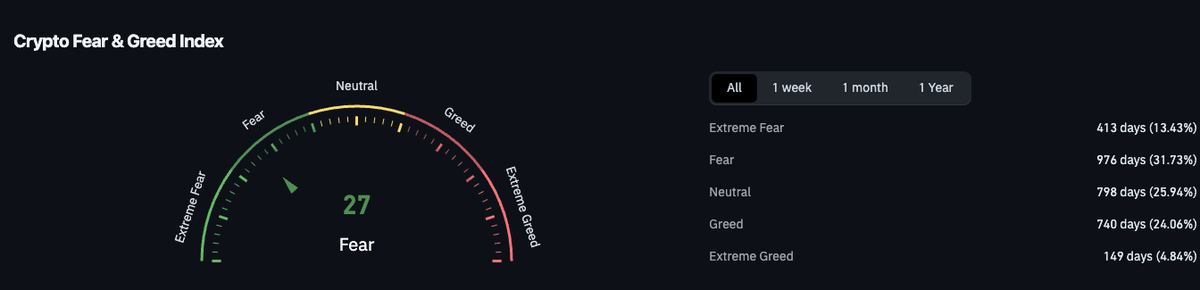
The Crypto Fear and Greed Index slipped to 27 from 29, deeper into Fear even as Bitcoin held and altcoins rose. That gap between price and sentiment is the point: the crowd is not buying this move.
Source: https://www.coinglass.com/pro/i/FearGreedIndex
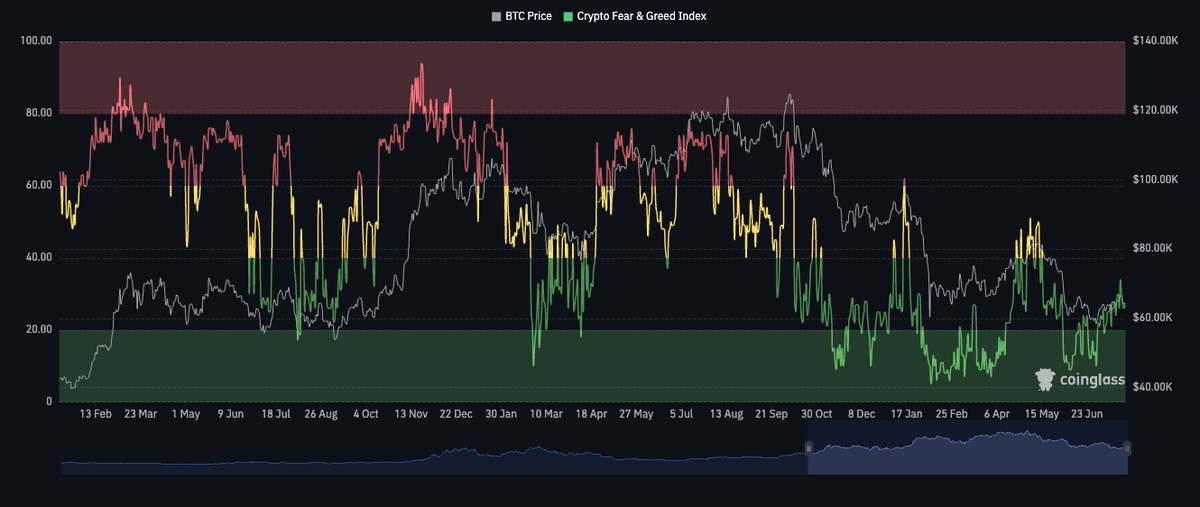
Fear and Extreme Fear together account for 1,389 days, 45.2% of the index’s history, against 4.84% for Extreme Greed. The history chart shows why low readings are watched: green clusters below 20 have repeatedly formed near price lows rather than after them. While the index sits here, the medium-term trend offers something for traders who control risk well, which is not a recommendation to trade.
The Fed meets Wednesday with the dollar already tightening
The FOMC announces on Wednesday, July 29, at 2 p.m. ET, with Chair Warsh taking questions half an hour later. Economists surveyed by FactSet expect a hold at 3.50% to 3.75%, a fifth consecutive pause, and prediction markets price roughly 80% for no change against about 19% for a hike. No new projections arrive at this meeting, so the statement language carries the weight.
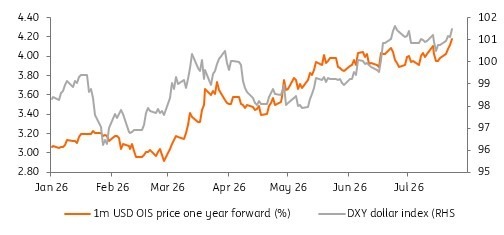
The chart sets the market’s answer next to the currency. The orange line is the one-month USD overnight index swap rate priced one year forward, up from near 3.0% in January to about 4.15% now. The grey line is the dollar index, up from near 96.5 to about 101.3. Rate expectations and the dollar have tightened together, which makes life harder for risk assets, crypto included.
The Middle East moved both. A thirteenth straight day of US strikes on Iran, attacks on shipping near the Strait of Hormuz and a naval blockade have kept a war premium in oil, with Brent below $98 but up over 12% on the week and roughly 31% above pre-conflict levels. Odds of a September hike have climbed above 78%, and a statement leaning on energy prices would harden that pricing further.
Is this the bottom for Ethereum?
Ethereum trades near $1,920, roughly 17% below its realized price of $2,304 and in the lower half of its realized price band, a zone historically associated with market lows and asymmetric upside. Against Bitcoin rather than dollars, the picture has moved from extremely overvalued to broadly neutral.
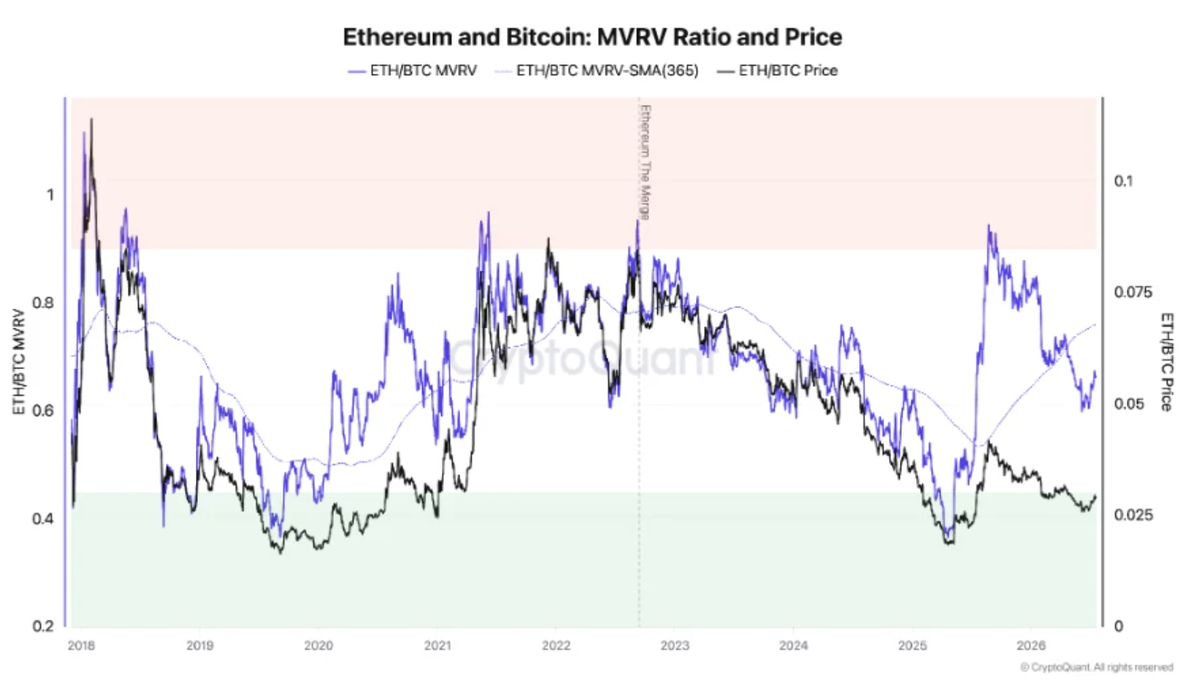
The ETH/BTC MVRV ratio peaked near 0.95 in August 2025 and now reads about 0.65, still above the 0.45 threshold that marked previous Ethereum bottoms against Bitcoin. Selling pressure is easing with it: the exchange inflow ratio has dropped from above 1.5 in August 2025 to roughly 0.8, short of the 0.4 zone seen at prior bottoms. Weekly ETH/BTC spot volume has collapsed from about 1.75 to roughly 0.5, a range historically consistent with price bottoms.
Institutional demand has turned for the first time in a year. The ETH/BTC ETF holdings ratio fell from about 0.20 in August 2025 to 0.115 in June 2026, then recovered to roughly 0.13 since late June, an early sign allocators are tilting back. Two of these five signals sit at bottoming levels and three are improving without being there, which argues for a process rather than an event.
On-chain metric to watch
Bitcoin is trading below the short-term holder realized price, the average cost basis of coins moved within the last 155 days. In early July that line sat near $69,000 with spot in the $62,800 to $63,300 range, and it has kept declining while price recovered part of the gap.
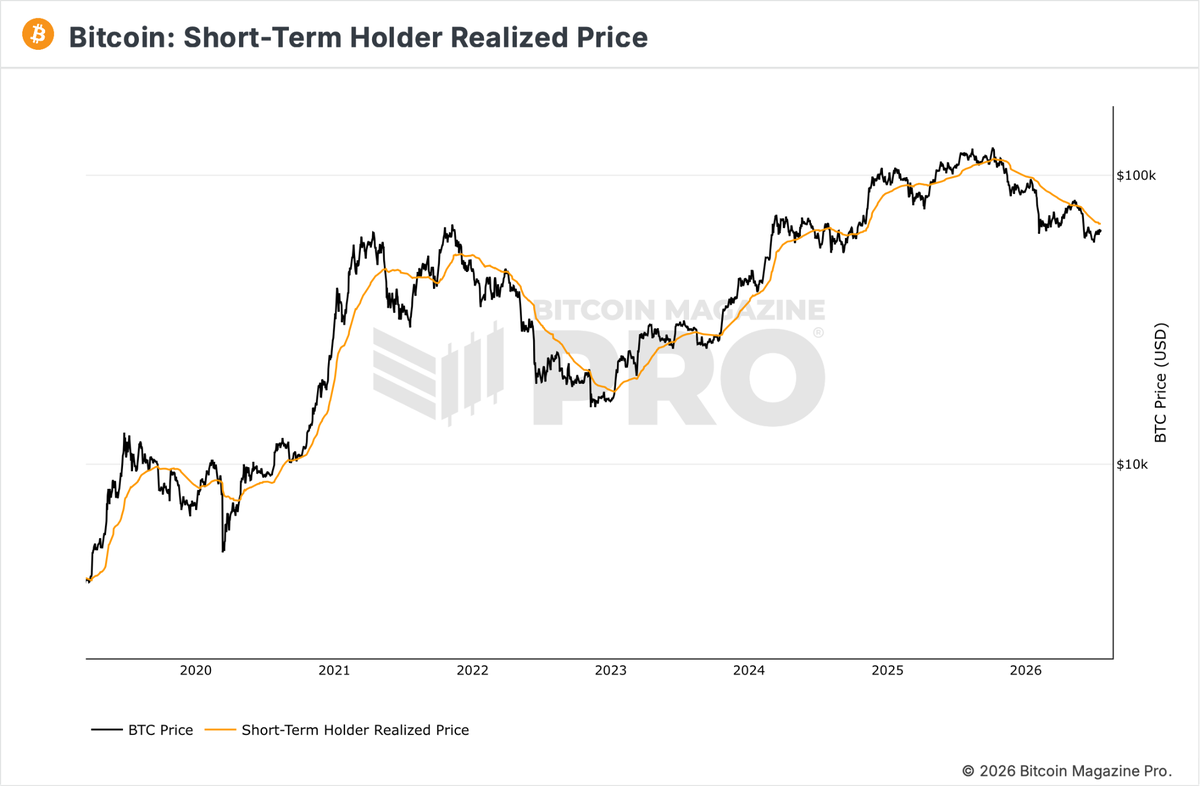
The pattern is straightforward. In bull markets price trends above this line, in bear markets below it, and the crossing back above has repeatedly marked the regime change rather than the low itself. In 2022 price lost the line near $30,000, slid under $20,000 and did not reclaim it until early 2023, roughly seven months later. The current stretch below has run about five months.
Two things resolve it: price rising to meet the line, or the line falling to meet price as newer coins reset the cost basis lower, and the chart shows the second already running. A reclaim would confirm what the RSI divergence and the Ethereum signals above only hint at. Until then, every rally into that band meets supply from short-term holders looking to break even.
Conclusion
Four signals point the same way without any being conclusive. Bitcoin is consolidating on the 50-day EMA with an unfilled gap above it, the Altcoin Season Index has run from 10 to 60 in seven weeks, sentiment sits at 27 while price holds, and Ethereum has two of five bottoming signals in place. Altcoins are where that combination usually shows up first.
The counterweight sits on Wednesday. Forward rate pricing near 4.15% and a dollar index at 101.3 have tightened conditions before the Fed says anything, and the oil premium keeps the inflation path open in the wrong direction. This is still a bear market, spot remains below the short-term holder cost basis, and nothing here guarantees a continuation. The indicators lean constructive for the week ahead, and position sizing is what makes that lean survivable.
Trading involves risk.